Smart lending relies on open accounting data — real-time access to a borrower's financial records through accounting APIs, enabling faster underwriting and more accurate risk assessment.
Profit and Loss & Balance Sheet API
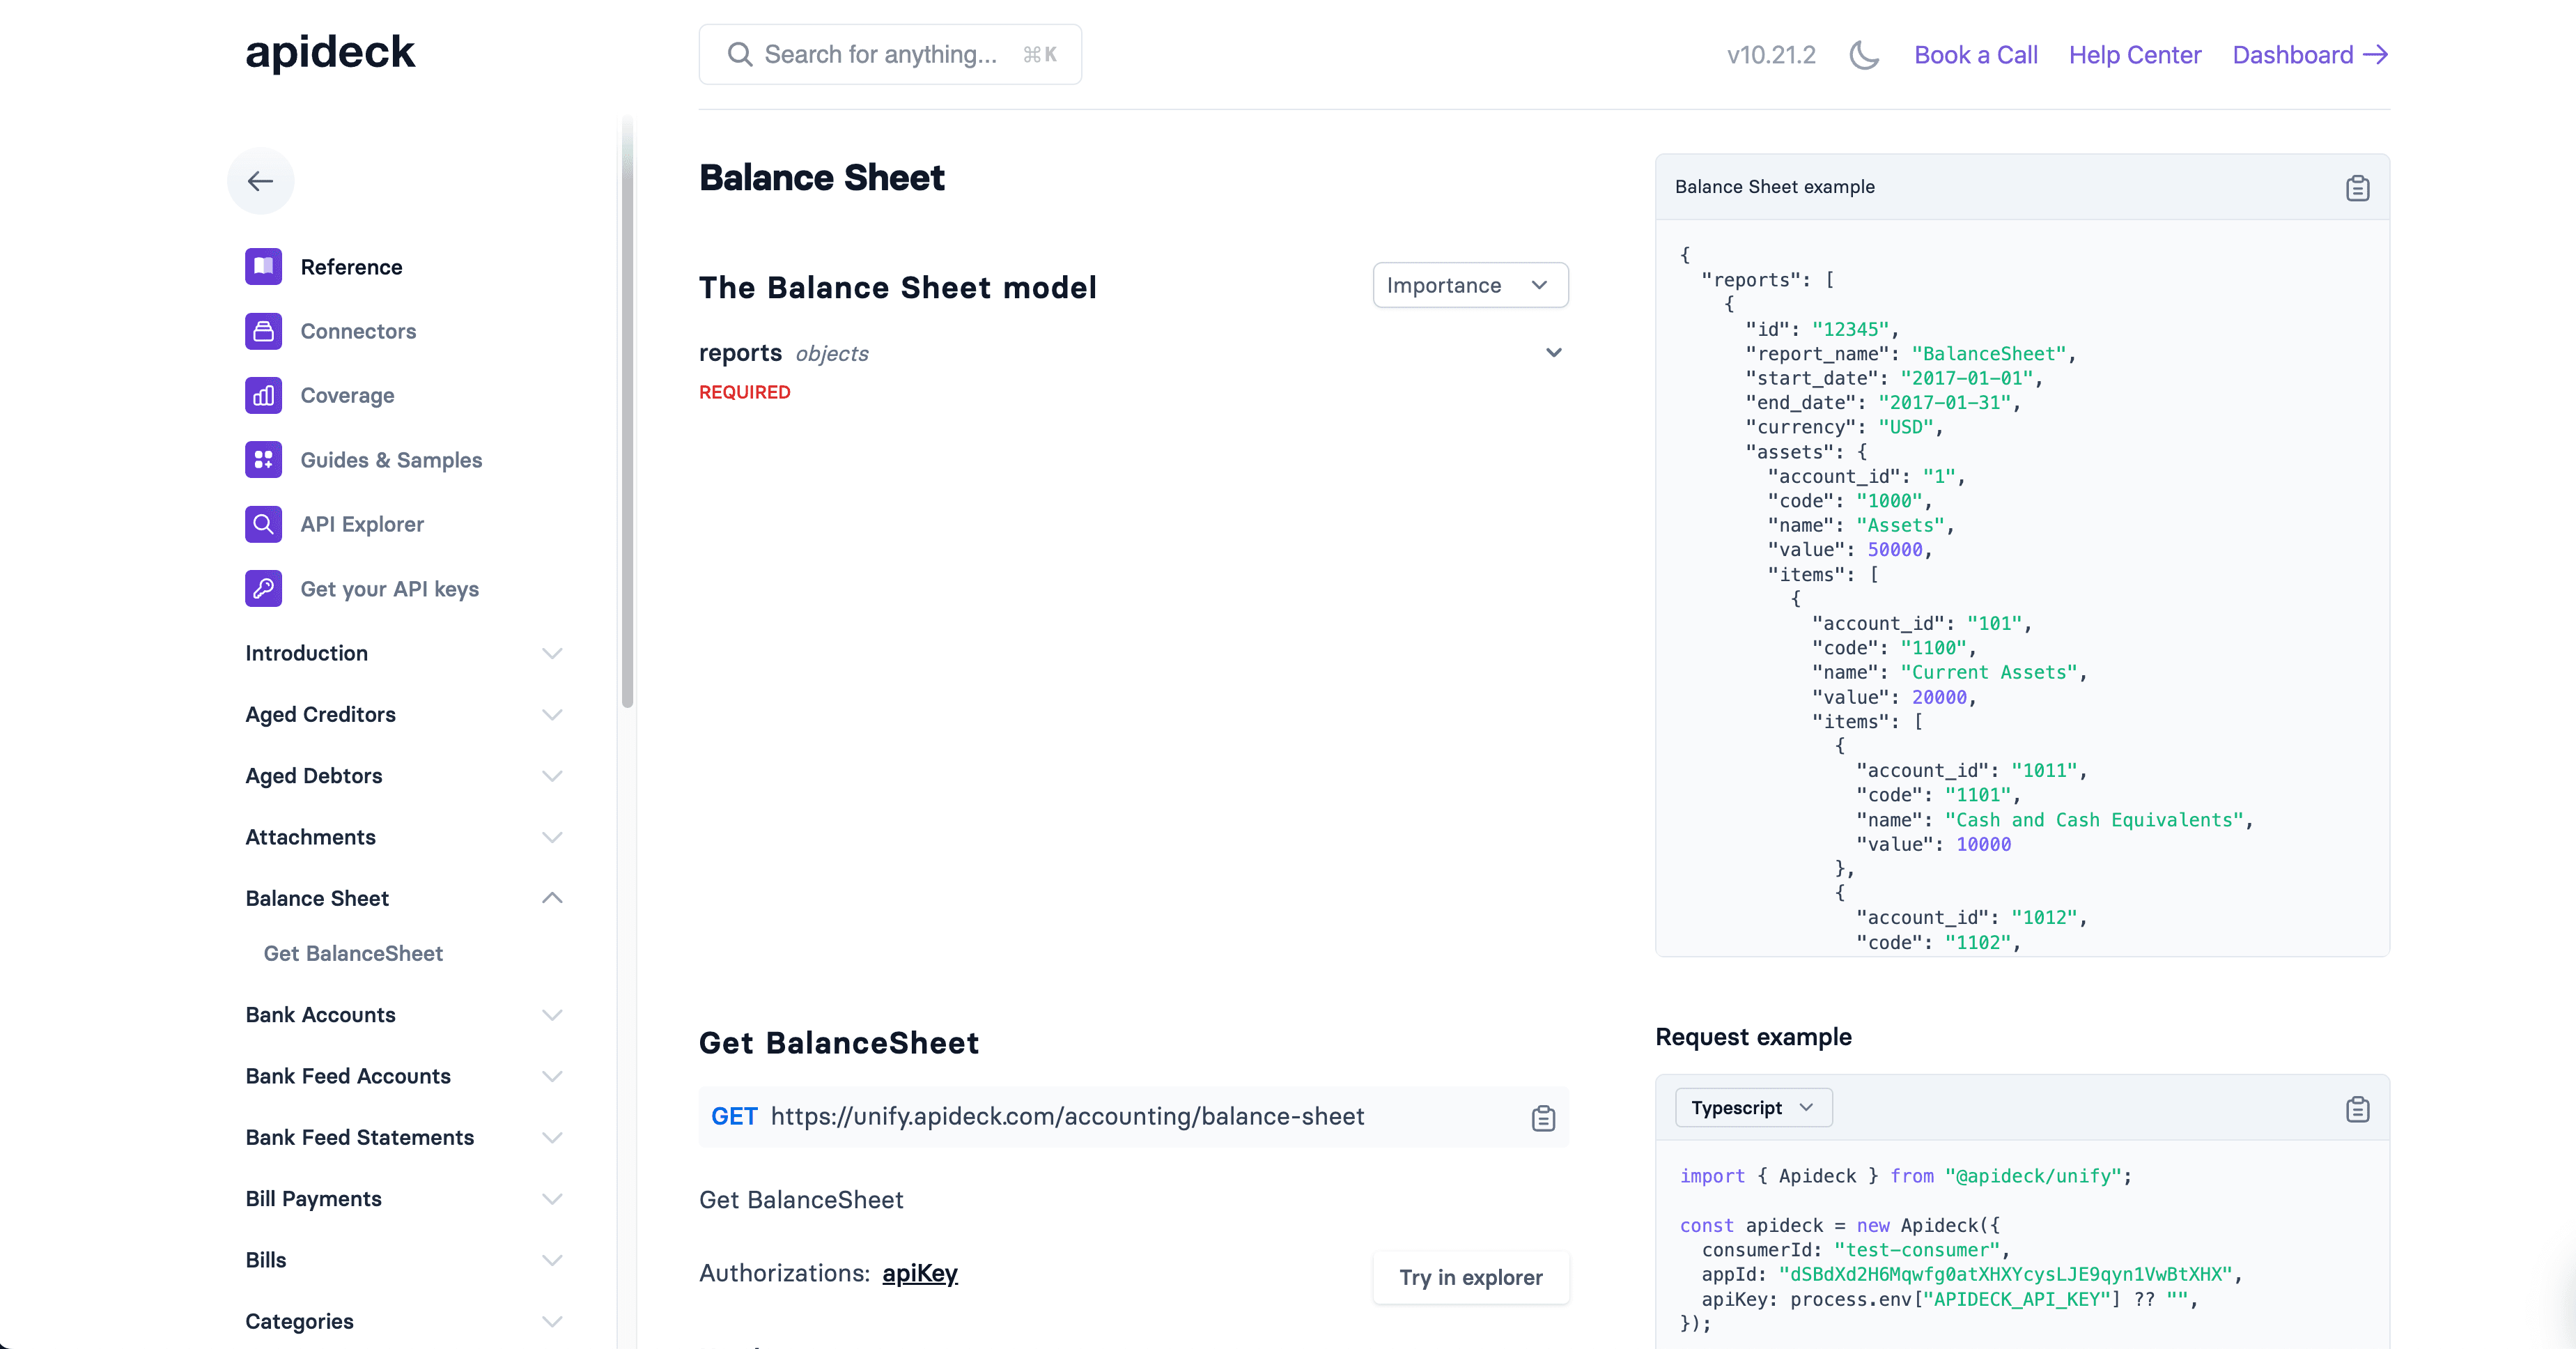
The Profit and Loss (P&L) and Balance Sheet are the two most critical financial statements for assessing business health and creditworthiness. Using Apideck's unified Accounting API, you can retrieve standardized financial data from multiple accounting platforms through single endpoints.
API Endpoints:
GET /accounting/profit-and-loss- Income statementGET /accounting/balance-sheet- Financial position snapshot
Documentation Reference: Apideck Accounting API
Understanding the Financial Statements
Profit and Loss Statement (Income Statement)
Answers: "Did we make money or lose money during this period?"
Time Frame: Period of time (e.g., month, quarter, year)
Shows:
- Revenue earned during the period
- Expenses incurred during the period
- Profitability over time
Balance Sheet (Statement of Financial Position)
Answers: "What does the company own and owe at this moment?"
Time Frame: Snapshot at a specific point in time (e.g., December 31, 2025)
Shows:
- Assets (what the company owns)
- Liabilities (what the company owes)
- Equity (owner's stake in the business)
Why Both Matter for Lending
| Statement | What It Reveals | Lending Insight |
|---|---|---|
| P&L | Profitability & cash generation | Can they afford loan payments? |
| Balance Sheet | Financial strength & leverage | Do they have enough assets? Are they over-leveraged? |
| Combined | Complete financial picture | Comprehensive risk assessment |
Example:
- A business might show strong profits (P&L) but have weak liquidity (Balance Sheet) - risky for short-term loans
- A business might have low profits (P&L) but strong assets (Balance Sheet) - good for secured loans
B2B Lending & Credit Assessment Use Cases
Why These Statements Matter for Lenders
Profit and Loss Analysis:
- Revenue Consistency - Is income stable or volatile?
- Profitability - Can the business generate sustainable profits?
- Operating Efficiency - How well does the company control costs?
- Debt Service Capacity - Can the business afford loan payments?
Balance Sheet Analysis:
- Liquidity - Can the business pay short-term obligations?
- Solvency - Is the business over-leveraged with debt?
- Asset Quality - What collateral is available?
- Working Capital - Is the business efficiently managing operations?
Common Lending Scenarios
1. Working Capital Loans
- P&L Focus: Cash flow generation and operating expenses
- Balance Sheet Focus: Current assets, current liabilities, working capital
- Key Metrics: Current ratio, quick ratio, revenue trends
- Typical Use: Short-term financing for inventory, payroll, or operations
2. Equipment Financing
- P&L Focus: Profitability and depreciation capacity
- Balance Sheet Focus: Existing fixed assets, total debt levels
- Key Metrics: Debt-to-assets ratio, asset turnover
- Typical Use: Asset purchases that improve operations
3. Term Loans
- P&L Focus: Sustained profitability and EBITDA
- Balance Sheet Focus: Total debt, equity, collateral availability
- Key Metrics: Debt-to-equity ratio, DSCR, ROE
- Typical Use: Business expansion, acquisitions
4. Asset-Based Lending
- P&L Focus: Revenue stability
- Balance Sheet Focus: Accounts receivable, inventory quality
- Key Metrics: AR turnover, inventory turnover, collateral value
- Typical Use: Leveraging assets for immediate cash needs
API Usage
Profit and Loss API
Basic Request
GET /accounting/profit-and-loss HTTP/1.1
Host: unify.apideck.com
Authorization: Bearer {your-api-key}
x-apideck-consumer-id: {consumer-id}
x-apideck-app-id: {application-id}
x-apideck-service-id: {connector-service-id}
Request Parameters
| Parameter | Type | Required | Description |
|---|---|---|---|
start_date | string | No | Start date for the report (ISO 8601 format: YYYY-MM-DD) |
end_date | string | No | End date for the report (ISO 8601 format: YYYY-MM-DD) |
filter[currency] | string | No | Filter by specific currency code (e.g., USD, EUR) |
Date Handling Rules
Default Behavior (when no dates provided):
- Returns data for the current month (from 1st of the month to today)
Partial Date Scenarios:
- If only
end_dateprovided: Returns data from the first day of that month to the specified end date - If only
start_dateprovided: Returns data from the start date to the last day of that month - If both dates provided: Returns data for the exact date range specified
Balance Sheet API
Basic Request
GET /accounting/balance-sheet HTTP/1.1
Host: unify.apideck.com
Authorization: Bearer {your-api-key}
x-apideck-consumer-id: {consumer-id}
x-apideck-app-id: {application-id}
x-apideck-service-id: {connector-service-id}
Request Parameters
| Parameter | Type | Required | Description |
|---|---|---|---|
date | string | No | Date for the balance sheet snapshot (ISO 8601 format: YYYY-MM-DD) |
filter[currency] | string | No | Filter by specific currency code (e.g., USD, EUR) |
Date Handling Rules
Default Behavior (when no date provided):
- Returns balance sheet as of today's date
Specified Date:
- Returns balance sheet snapshot as of the specified date
Response Structures
Profit and Loss Response
{
  "status_code": 200,
  "status": "OK",
  "data": {
    "id": "profit-loss-2025-10",
    "report_name": "Profit and Loss",
    "start_date": "2025-10-01",
    "end_date": "2025-10-31",
    "currency": "USD",
    "revenue": {
      "title": "Revenue",
      "type": "Revenue",
      "total": 125000.00,
      "records": [
        {
          "id": "110",
          "title": "Sales Revenue",
          "type": "Revenue",
          "total": 100000.00,
          "records": [
            {
              "id": "acc-001",
              "title": "Product Sales",
              "code": "4100",
              "total": 75000.00
            }
          ]
        }
      ]
    },
    "expenses": {
      "title": "Expenses",
      "type": "Expenses",
      "total": 80000.00,
      "records": [
        {
          "id": "111",
          "title": "Cost of Goods Sold",
          "type": "Expenses",
          "total": 40000.00,
          "records": [
            {
              "id": "acc-101",
              "title": "Direct Materials",
              "code": "5100",
              "total": 40000.00
            }
          ]
        }
      ]
    },
    "gross_profit": 85000.00,
    "net_operating_income": 55000.00,
    "net_income": 45000.00
  }
}
Balance Sheet Response
{
  "status_code": 200,
  "status": "OK",
  "data": {
    "id": "balance-sheet-2025-10-31",
    "report_name": "Balance Sheet",
    "date": "2025-10-31",
    "currency": "USD",
    "assets": {
      "title": "Assets",
      "type": "Assets",
      "total": 500000.00,
      "current_assets": {
        "title": "Current Assets",
        "total": 250000.00,
        "records": [
          {
            "id": "cash",
            "title": "Cash and Cash Equivalents",
            "code": "1000",
            "total": 75000.00
          },
          {
            "id": "ar",
            "title": "Accounts Receivable",
            "code": "1200",
            "total": 100000.00
          },
          {
            "id": "inventory",
            "title": "Inventory",
            "code": "1300",
            "total": 75000.00
          }
        ]
      },
      "non_current_assets": {
        "title": "Non-Current Assets",
        "total": 250000.00,
        "records": [
          {
            "id": "ppe",
            "title": "Property, Plant & Equipment",
            "code": "1500",
            "total": 200000.00
          },
          {
            "id": "intangibles",
            "title": "Intangible Assets",
            "code": "1600",
            "total": 50000.00
          }
        ]
      }
    },
    "liabilities": {
      "title": "Liabilities",
      "type": "Liabilities",
      "total": 250000.00,
      "current_liabilities": {
        "title": "Current Liabilities",
        "total": 100000.00,
        "records": [
          {
            "id": "ap",
            "title": "Accounts Payable",
            "code": "2000",
            "total": 50000.00
          },
          {
            "id": "short-debt",
            "title": "Short-term Debt",
            "code": "2100",
            "total": 30000.00
          },
          {
            "id": "accrued",
            "title": "Accrued Expenses",
            "code": "2200",
            "total": 20000.00
          }
        ]
      },
      "non_current_liabilities": {
        "title": "Non-Current Liabilities",
        "total": 150000.00,
        "records": [
          {
            "id": "long-debt",
            "title": "Long-term Debt",
            "code": "2500",
            "total": 150000.00
          }
        ]
      }
    },
    "equity": {
      "title": "Equity",
      "type": "Equity",
      "total": 250000.00,
      "records": [
        {
          "id": "capital",
          "title": "Owner's Capital",
          "code": "3000",
          "total": 200000.00
        },
        {
          "id": "retained",
          "title": "Retained Earnings",
          "code": "3100",
          "total": 50000.00
        }
      ]
    }
  }
}
Balance Sheet Structure Explained
The Accounting Equation
Assets = Liabilities + Equity
This fundamental equation must always balance.
Assets
What the company owns
Current Assets (liquid within 12 months)
- Cash - Money in bank accounts
- Accounts Receivable - Money customers owe
- Inventory - Goods for sale
- Prepaid Expenses - Advance payments
Non-Current Assets (long-term)
- Property, Plant & Equipment (PP&E) - Buildings, machinery, vehicles
- Intangible Assets - Patents, trademarks, goodwill
- Long-term Investments - Stocks, bonds held >1 year
Liabilities
What the company owes
Current Liabilities (due within 12 months)
- Accounts Payable - Money owed to suppliers
- Short-term Debt - Loans due within 1 year
- Accrued Expenses - Wages, taxes owed but not yet paid
Non-Current Liabilities (long-term)
- Long-term Debt - Loans due after 1 year
- Deferred Revenue - Payments received for future services
- Pension Obligations - Future retirement payments
Equity
Owner's stake in the business
- Owner's Capital - Initial investment
- Retained Earnings - Accumulated profits not distributed
- Additional Paid-in Capital - Stock proceeds above par value
Financial Ratios Using P&L and Balance Sheet
1. Profitability Ratios (P&L Focus)
Gross Profit Margin
const grossProfitMargin = (plData.gross_profit / plData.revenue.total) * 100


// Example: 68% (Strong - keeps 68% of revenue after direct costs)
Net Profit Margin
const netProfitMargin = (plData.net_income / plData.revenue.total) * 100


// Example: 36% (Excellent - keeps 36% of revenue as profit)
Return on Assets (ROA) - P&L + Balance Sheet
const roa = (plData.net_income / bsData.assets.total) * 100


// Example: 9% (Strong - generates $9 profit per $100 of assets)
// Good: >5% for most industries
Return on Equity (ROE) - P&L + Balance Sheet
const roe = (plData.net_income / bsData.equity.total) * 100


// Example: 18% (Excellent - generates $18 profit per $100 of equity)
// Good: >15% for most industries
2. Liquidity Ratios (Balance Sheet Focus)
Current Ratio
const currentRatio =
  bsData.assets.current_assets.total /
  bsData.liabilities.current_liabilities.total


// Example: 2.5 (Strong - $2.50 in current assets for every $1 of current liabilities)
// Good: 1.5 - 3.0
// Warning: <1.0 (may struggle to pay bills)
Quick Ratio (Acid Test)
const quickAssets =
  bsData.assets.current_assets.total -
  findAccount(bsData.assets.current_assets, 'Inventory')


const quickRatio = quickAssets / bsData.liabilities.current_liabilities.total


// Example: 1.75 (Strong - can cover liabilities without selling inventory)
// Good: >1.0
// Warning: <0.5 (liquidity crisis risk)
Cash Ratio
const cash = findAccount(bsData.assets.current_assets, 'Cash')
const cashRatio = cash / bsData.liabilities.current_liabilities.total


// Example: 0.75 (75 cents of cash for every $1 of current liabilities)
// Good: >0.5
// Warning: <0.2 (very tight cash position)
Working Capital
const workingCapital =
  bsData.assets.current_assets.total -
  bsData.liabilities.current_liabilities.total


// Example: $150,000 (positive working capital - healthy)
// Good: Positive and growing
// Warning: Negative (can't cover short-term obligations)
3. Leverage Ratios (Balance Sheet Focus)
Debt-to-Assets Ratio
const debtToAssets = (bsData.liabilities.total / bsData.assets.total) * 100


// Example: 50% (Half of assets financed by debt)
// Good: <50% for most businesses
// Warning: >70% (highly leveraged, risky)
Debt-to-Equity Ratio
const debtToEquity = bsData.liabilities.total / bsData.equity.total


// Example: 1.0 (Equal parts debt and equity)
// Good: <1.0 for most industries (more equity than debt)
// Acceptable: 1.0-2.0 (depending on industry)
// Warning: >3.0 (over-leveraged)
Equity Ratio
const equityRatio = (bsData.equity.total / bsData.assets.total) * 100


// Example: 50% (Owners fund half the business)
// Good: >40%
// Warning: <20% (most assets financed by debt)
4. Efficiency Ratios (P&L + Balance Sheet)
Asset Turnover
// Measures how efficiently assets generate revenue
const assetTurnover = plData.revenue.total / bsData.assets.total


// Example: 0.25 (Generates $0.25 revenue per $1 of assets)
// Good: >1.0 for retail, >0.5 for manufacturing
// Industry varies widely
Inventory Turnover
// How many times inventory is sold and replaced per period
const cogs = findExpenseCategory(plData, 'Cost of Goods Sold')
const inventory = findAccount(bsData.assets.current_assets, 'Inventory')


const inventoryTurnover = cogs / inventory


// Example: 5.33 (Inventory sold and replaced 5.33 times per year)
// Good: 5-10 for retail, varies by industry
// Warning: <3 (slow-moving inventory)
Days Inventory Outstanding (DIO)
const dio = (inventory / cogs) * 365


// Example: 68 days (Inventory sits for ~2 months before selling)
// Good: 30-60 days for retail
// Warning: >90 days (potential obsolescence risk)
Accounts Receivable Turnover
const ar = findAccount(bsData.assets.current_assets, 'Accounts Receivable')
const arTurnover = plData.revenue.total / ar


// Example: 12.5 (Collect receivables 12.5 times per year)
// Good: >10 for most businesses
// Warning: <6 (slow collections)
Days Sales Outstanding (DSO)
const ar = findAccount(bsData.assets.current_assets, 'Accounts Receivable')
const dso = (ar / plData.revenue.total) * 365


// Example: 29 days (Takes 29 days on average to collect payment)
// Good: <30 days for most businesses
// Warning: >60 days (collection issues, cash flow problems)
Accounts Payable Turnover
const ap = findAccount(bsData.liabilities.current_liabilities, 'Accounts Payable')
const cogs = findExpenseCategory(plData, 'Cost of Goods Sold')
const apTurnover = cogs / ap


// Example: 8 (Pay suppliers 8 times per year)
// Good: 6-12 for most businesses
// Warning: <4 (may indicate cash flow problems) or >15 (not utilizing credit terms)
Days Payable Outstanding (DPO)
const dpo = (ap / cogs) * 365


// Example: 46 days (Takes 46 days on average to pay suppliers)
// Good: 30-60 days (using credit terms effectively)
// Warning: >90 days (may damage supplier relationships)
Cash Conversion Cycle (CCC)
// Measures how long cash is tied up in operations
const ccc = dio + dso - dpo


// Example: 51 days (Cash tied up for 51 days before returning)
// Good: <30 days (efficient working capital management)
// Acceptable: 30-60 days
// Warning: >90 days (inefficient, needs more working capital)
5. Debt Service Coverage Ratios (P&L + Balance Sheet)
EBITDA
function calculateEBITDA(plData, bsData) {
  const netIncome = plData.net_income


  // Add back non-cash expenses
  const depreciation = findExpenseCategory(plData, 'Depreciation') || 0
  const amortization = findExpenseCategory(plData, 'Amortization') || 0


  // Add back interest and taxes
  const interestExpense = findAccountsByKeyword(plData, 'interest')
  const taxes = findExpenseCategory(plData, 'Income Taxes') || 0


  const ebitda = netIncome + interestExpense + taxes + depreciation + amortization


  return ebitda
}


// Example: $75,000 EBITDA
Debt Service Coverage Ratio (DSCR)
async function calculateDSCR(plData, bsData, annualDebtService) {
  const ebitda = calculateEBITDA(plData, bsData)
  const dscr = ebitda / annualDebtService


  return {
    ebitda,
    annualDebtService,
    dscr,
    assessment: getDSCRAssessment(dscr)
  }
}


function getDSCRAssessment(dscr) {
  if (dscr >= 2.0) return 'Excellent - Strong debt capacity'
  if (dscr >= 1.5) return 'Good - Adequate coverage'
  if (dscr >= 1.25) return 'Acceptable - Minimum coverage'
  if (dscr >= 1.0) return 'Marginal - Tight coverage'
  return 'Critical - Cannot cover debt service'
}


// Example: DSCR = 1.5 (Business generates $1.50 for every $1 of debt payments)
Interest Coverage Ratio
const interestExpense = findAccountsByKeyword(plData, 'interest')
const interestCoverage = plData.net_operating_income / interestExpense


// Example: 5.5 (Operating income covers interest 5.5 times)
// Good: >3.0 (comfortable coverage)
// Warning: <1.5 (may struggle with interest payments)
// Critical: <1.0 (cannot cover interest from operations)
Complete Credit Assessment Framework
Comprehensive Risk Scoring Model
async function comprehensiveCreditAssessment(customerId, assessmentPeriod) {
  // Fetch both statements
  const [plData, bsData] = await Promise.all([
    getProfitAndLoss(assessmentPeriod.start, assessmentPeriod.end),
    getBalanceSheet(assessmentPeriod.end)
  ])


  // Fetch historical data for trends
  const historicalPL = await getHistoricalPL(customerId, 12) // 12 months


  let assessment = {
    overallScore: 100,
    ratings: {},
    redFlags: [],
    greenFlags: [],
    recommendation: null
  }


  // 1. Profitability Assessment (20 points)
  const profitability = assessProfitability(plData, historicalPL)
  assessment.overallScore -= profitability.deduction
  assessment.ratings.profitability = profitability


  // 2. Liquidity Assessment (25 points)
  const liquidity = assessLiquidity(bsData)
  assessment.overallScore -= liquidity.deduction
  assessment.ratings.liquidity = liquidity


  // 3. Leverage Assessment (20 points)
  const leverage = assessLeverage(bsData)
  assessment.overallScore -= leverage.deduction
  assessment.ratings.leverage = leverage


  // 4. Debt Service Capacity (25 points)
  const debtCapacity = await assessDebtCapacity(plData, bsData)
  assessment.overallScore -= debtCapacity.deduction
  assessment.ratings.debtCapacity = debtCapacity


  // 5. Efficiency & Working Capital (10 points)
  const efficiency = assessEfficiency(plData, bsData)
  assessment.overallScore -= efficiency.deduction
  assessment.ratings.efficiency = efficiency


  // Compile flags
  assessment.redFlags = [
    ...profitability.redFlags,
    ...liquidity.redFlags,
    ...leverage.redFlags,
    ...debtCapacity.redFlags,
    ...efficiency.redFlags
  ]


  assessment.greenFlags = [
    ...profitability.greenFlags,
    ...liquidity.greenFlags,
    ...leverage.greenFlags,
    ...debtCapacity.greenFlags,
    ...efficiency.greenFlags
  ]


  // Final assessment
  assessment.overallScore = Math.max(0, assessment.overallScore)
  assessment.creditRating = getCreditRating(assessment.overallScore)
  assessment.recommendation = getRecommendation(assessment.overallScore, assessment.ratings)


  return assessment
}


// Profitability Assessment
function assessProfitability(plData, historicalPL) {
  let deduction = 0
  let redFlags = []
  let greenFlags = []


  // Net profit margin
  const netMargin = (plData.net_income / plData.revenue.total) * 100
  if (netMargin < 0) {
    deduction += 20
    redFlags.push({ severity: 'CRITICAL', issue: 'Business is unprofitable' })
  } else if (netMargin < 5) {
    deduction += 10
    redFlags.push({ severity: 'HIGH', issue: `Low net margin: ${netMargin.toFixed(1)}%` })
  } else if (netMargin > 15) {
    greenFlags.push(`Strong net margin: ${netMargin.toFixed(1)}%`)
  }


  // Revenue trend
  const revenueGrowth = calculateGrowthRate(historicalPL, 'revenue')
  if (revenueGrowth < -10) {
    deduction += 5
    redFlags.push({ severity: 'HIGH', issue: `Declining revenue: ${revenueGrowth.toFixed(1)}%` })
  } else if (revenueGrowth > 20) {
    greenFlags.push(`Strong revenue growth: ${revenueGrowth.toFixed(1)}%`)
  }


  return {
    deduction,
    redFlags,
    greenFlags,
    score: 20 - deduction,
    metrics: {
      netMargin,
      revenueGrowth,
      grossMargin: (plData.gross_profit / plData.revenue.total) * 100
    }
  }
}


// Liquidity Assessment
function assessLiquidity(bsData) {
  let deduction = 0
  let redFlags = []
  let greenFlags = []


  // Current ratio
  const currentRatio = bsData.assets.current_assets.total / bsData.liabilities.current_liabilities.total
  if (currentRatio < 1.0) {
    deduction += 15
    redFlags.push({ severity: 'CRITICAL', issue: `Current ratio below 1.0: ${currentRatio.toFixed(2)}` })
  } else if (currentRatio < 1.5) {
    deduction += 8
    redFlags.push({ severity: 'MEDIUM', issue: `Low current ratio: ${currentRatio.toFixed(2)}` })
  } else if (currentRatio > 2.0) {
    greenFlags.push(`Strong current ratio: ${currentRatio.toFixed(2)}`)
  }


  // Working capital
  const workingCapital = bsData.assets.current_assets.total - bsData.liabilities.current_liabilities.total
  if (workingCapital < 0) {
    deduction += 10
    redFlags.push({ severity: 'CRITICAL', issue: 'Negative working capital' })
  } else {
    const wcRatio = (workingCapital / bsData.assets.current_assets.total) * 100
    if (wcRatio > 30) {
      greenFlags.push(`Healthy working capital: ${wcRatio.toFixed(0)}% of current assets`)
    }
  }


  return {
    deduction,
    redFlags,
    greenFlags,
    score: 25 - deduction,
    metrics: {
      currentRatio,
      workingCapital,
      quickRatio: calculateQuickRatio(bsData)
    }
  }
}


// Leverage Assessment
function assessLeverage(bsData) {
  let deduction = 0
  let redFlags = []
  let greenFlags = []


  // Debt-to-equity ratio
  const debtToEquity = bsData.liabilities.total / bsData.equity.total
  if (debtToEquity > 3.0) {
    deduction += 15
    redFlags.push({ severity: 'CRITICAL', issue: `Very high debt-to-equity: ${debtToEquity.toFixed(2)}` })
  } else if (debtToEquity > 2.0) {
    deduction += 8
    redFlags.push({ severity: 'MEDIUM', issue: `High debt-to-equity: ${debtToEquity.toFixed(2)}` })
  } else if (debtToEquity < 1.0) {
    greenFlags.push(`Conservative leverage: ${debtToEquity.toFixed(2)}`)
  }


  // Debt-to-assets ratio
  const debtToAssets = (bsData.liabilities.total / bsData.assets.total) * 100
  if (debtToAssets > 70) {
    deduction += 5
    redFlags.push({ severity: 'HIGH', issue: `High debt-to-assets: ${debtToAssets.toFixed(0)}%` })
  } else if (debtToAssets < 40) {
    greenFlags.push(`Low debt-to-assets: ${debtToAssets.toFixed(0)}%`)
  }


  return {
    deduction,
    redFlags,
    greenFlags,
    score: 20 - deduction,
    metrics: {
      debtToEquity,
      debtToAssets,
      equityRatio: (bsData.equity.total / bsData.assets.total) * 100
    }
  }
}
Practical Integration Examples
Example 1: Complete Credit Check
async function performCreditCheck(customerId) {
  try {
    // Fetch current period P&L and Balance Sheet
    const endDate = new Date().toISOString().split('T')[0]
    const startDate = new Date(new Date().setMonth(new Date().getMonth() - 12))
      .toISOString().split('T')[0]


    const [plData, bsData] = await Promise.all([
      fetch(`/accounting/profit-and-loss?start_date=${startDate}&end_date=${endDate}`, {
        headers: {
          'Authorization': 'Bearer YOUR_API_KEY',
          'x-apideck-consumer-id': customerId,
          'x-apideck-app-id': 'APP_ID',
          'x-apideck-service-id': 'quickbooks'
        }
      }).then(r => r.json()),


      fetch(`/accounting/balance-sheet?date=${endDate}`, {
        headers: {
          'Authorization': 'Bearer YOUR_API_KEY',
          'x-apideck-consumer-id': customerId,
          'x-apideck-app-id': 'APP_ID',
          'x-apideck-service-id': 'quickbooks'
        }
      }).then(r => r.json())
    ])


    // Calculate key ratios
    const ratios = {
      profitability: {
        netMargin: (plData.data.net_income / plData.data.revenue.total) * 100,
        roa: (plData.data.net_income / bsData.data.assets.total) * 100,
        roe: (plData.data.net_income / bsData.data.equity.total) * 100
      },
      liquidity: {
        currentRatio: bsData.data.assets.current_assets.total / bsData.data.liabilities.current_liabilities.total,
        quickRatio: calculateQuickRatio(bsData.data),
        workingCapital: bsData.data.assets.current_assets.total - bsData.data.liabilities.current_liabilities.total
      },
      leverage: {
        debtToEquity: bsData.data.liabilities.total / bsData.data.equity.total,
        debtToAssets: (bsData.data.liabilities.total / bsData.data.assets.total) * 100
      }
    }


    // Generate recommendation
    const recommendation = generateLendingRecommendation(ratios)


    return {
      customerId,
      assessmentDate: endDate,
      ratios,
      recommendation,
      rawData: { plData, bsData }
    }


  } catch (error) {
    console.error('Credit check failed:', error)
    throw error
  }
}
Example 2: Loan Amount Calculator
function calculateMaxLoanAmount(plData, bsData, loanTermMonths) {
  // Calculate EBITDA
  const ebitda = calculateEBITDA(plData, bsData)


  // Assume lender requires DSCR of 1.5
  const requiredDSCR = 1.5
  const maxAnnualDebtService = ebitda / requiredDSCR


  // Convert to monthly payment
  const maxMonthlyPayment = maxAnnualDebtService / 12


  // Calculate loan amount based on term and interest rate (assume 8%)
  const monthlyRate = 0.08 / 12
  const maxLoanAmount = maxMonthlyPayment *
    ((1 - Math.pow(1 + monthlyRate, -loanTermMonths)) / monthlyRate)


  // Also check collateral availability (typically 70-80% of assets)
  const collateralBased = bsData.assets.total * 0.75


  // Use lower of the two
  const recommendedAmount = Math.min(maxLoanAmount, collateralBased)


  return {
    ebitda,
    maxAnnualDebtService,
    maxMonthlyPayment,
    cashFlowBasedLimit: maxLoanAmount,
    collateralBasedLimit: collateralBased,
    recommendedLoanAmount: recommendedAmount,
    monthlyPayment: calculateMonthlyPayment(recommendedAmount, 0.08, loanTermMonths)
  }
}
Example 3: Monitoring Dashboard
async function generateLenderDashboard(portfolioCustomers) {
  const dashboardData = await Promise.all(
    portfolioCustomers.map(async (customer) => {
      const [plData, bsData] = await Promise.all([
        getProfitAndLoss(customer.id),
        getBalanceSheet(customer.id)
      ])


      return {
        customerId: customer.id,
        name: customer.name,
        loanAmount: customer.loanAmount,
        health: {
          dscr: calculateDSCR(plData, bsData, customer.annualDebtService),
          currentRatio: bsData.assets.current_assets.total / bsData.liabilities.current_liabilities.total,
          debtToEquity: bsData.liabilities.total / bsData.equity.total
        },
        alerts: identifyAlerts(plData, bsData, customer),
        trend: customer.historicalHealth?.dscr > calculateDSCR(plData, bsData, customer.annualDebtService) ? 'declining' : 'improving'
      }
    })
  )


  return {
    totalPortfolioValue: dashboardData.reduce((sum, c) => sum + c.loanAmount, 0),
    healthyLoans: dashboardData.filter(c => c.health.dscr >= 1.5).length,
    watchList: dashboardData.filter(c => c.health.dscr < 1.5 && c.health.dscr >= 1.25),
    highRisk: dashboardData.filter(c => c.health.dscr < 1.25),
    customers: dashboardData
  }
}
Best Practices
1. Always Fetch Both Statements
// ✅ Good: Fetch in parallel for complete picture
const [plData, bsData] = await Promise.all([
  getProfitAndLoss(startDate, endDate),
  getBalanceSheet(endDate)
])


// ❌ Avoid: Using only one statement
const plData = await getProfitAndLoss(startDate, endDate)
// Missing critical balance sheet insights!
2. Use Appropriate Time Periods
// P&L: Use period matching loan term
// For 1-year loan, analyze 12+ months of P&L
const plData = await getProfitAndLoss('2024-01-01', '2024-12-31')


// Balance Sheet: Use most recent snapshot
const bsData = await getBalanceSheet('2024-12-31') // End of period
3. Combine with External Data
const creditAssessment = {
  financialRatios: calculateAllRatios(plData, bsData),
  creditScore: await getCreditScore(customerId), // External bureau
  industryBenchmarks: await getIndustryBenchmarks(customer.industry),
  paymentHistory: await getPaymentHistory(customerId)
}
Additional Resources
- Apideck Accounting API Reference - Complete API documentation
- Balance Sheet Endpoint - Balance sheet specific docs
- Profit and Loss Endpoint - P&L specific docs
- Ledger Accounts - Chart of accounts details
FAQ
Q: How often should I pull financial statements for monitoring?
A: For active loans, pull monthly Balance Sheets and quarterly P&L reports. High-risk customers may require monthly P&L monitoring.
Q: What if the Balance Sheet doesn't balance (Assets ≠ Liabilities + Equity)?
A: This indicates a data integrity issue. Contact the customer or verify the accounting system is properly closed for the period.
Q: Should I use cash or accrual accounting data?
A: Most lenders prefer accrual accounting as it provides a more accurate picture of financial health. Cash basis may understate obligations.
Q: What's more important - P&L or Balance Sheet?
A: Both are critical. P&L shows earning power; Balance Sheet shows financial strength. You need both for complete assessment.
Q: How do I handle seasonal businesses?
A: Compare year-over-year periods (Q3 2024 vs Q3 2025) rather than sequential quarters. Analyze 12+ months of data to capture full seasonal cycle.
Ready to get started?
Scale your integration strategy and deliver the integrations your customers need in record time.