Construction lending is one of the most complex areas of commercial financing - and for good reason. Unlike traditional business loans where you're assessing a stable, ongoing operation, construction lending requires evaluating companies with project-based revenue, seasonal cash flows, progress billing cycles, and significant working capital volatility.
For fintech developers building lending platforms, this complexity creates both a challenge and an opportunity. The right financial data analysis can unlock millions in construction loan volume, but only if you understand the unique metrics that separate successful contractors from those headed for trouble.
This comprehensive guide shows you how to leverage accounting APIs to automate construction credit assessment, calculate industry-specific financial ratios, and build lending decisioning systems that understand the nuances of contractor financials. Whether you're building equipment financing, working capital lines, or bonding capacity tools, this guide provides the blueprint.
Building a general B2B lending platform? Check out our foundational guide: Using Accounting APIs for Smart Lending Decisions which covers core profitability, liquidity, and leverage ratios applicable across all industries.
🏗️ Why Construction Lending Requires Specialized Analysis
The Construction Finance Paradox
A general contractor can show strong gross profit margins of 18% and still fail within months due to:
- Cash flow gaps - Billing monthly but paying subcontractors weekly
- Retainage holds - 5-10% of every invoice held back until project completion
- Material cost spikes - Lumber prices that double in 6 months
- Weather delays - Frozen ground stops work but doesn't stop expenses
- Bonding constraints - Can't bid new work until current projects advance
Traditional lending metrics miss these dynamics entirely. A strong current ratio means little when $500K is locked in retainage or when $2M of "current assets" are actually costs in excess of billings from an over-budget project.
What Makes Construction Different
| Traditional Business | Construction Business |
|---|---|
| Recurring revenue | Project-based contracts |
| Predictable cash flow | Progress billing cycles |
| Clear profit recognition | Percentage-of-completion accounting |
| Stable asset base | Equipment-intensive operations |
| Standard AR aging | Retainage + unbilled receivables |
| Year-round operations | Seasonal revenue patterns |
| Vendor payment terms | Subcontractor weekly pay cycles |
The bottom line: You need construction-specific metrics that account for Work in Progress (WIP), backlog, bonding capacity, and project-level profitability—not just company-level financials.
🔌 API Data Architecture for Construction Lending
Essential API Endpoints
To properly assess construction companies, you'll need data from multiple accounting endpoints:
// Comprehensive construction company financial snapshot
async function fetchConstructionFinancials(customerId, period) {
  const baseUrl = 'https://unify.apideck.com/accounting'


  // Core financial statements
  const [plData, bsData] = await Promise.all([
    fetch(`${baseUrl}/profit-and-loss?start_date=${period.start}&end_date=${period.end}`, {
      headers: {
        'Authorization': 'Bearer YOUR_API_KEY',
        'x-apideck-consumer-id': customerId,
        'x-apideck-app-id': 'YOUR_APP_ID',
        'x-apideck-service-id': 'quickbooks' // or 'xero', 'sage', etc.
      }
    }),
    fetch(`${baseUrl}/balance-sheet?date=${period.end}`, {
      headers: { /* same headers */ }
    })
  ])


  // Supporting data for construction-specific analysis
  const [customers, suppliers, invoices, bills, journalEntries] = await Promise.all([
    fetch(`${baseUrl}/customers`),           // AR aging analysis
    fetch(`${baseUrl}/suppliers`),           // Subcontractor payment tracking
    fetch(`${baseUrl}/invoices`),            // Billing patterns
    fetch(`${baseUrl}/bills`),               // Payables analysis
    fetch(`${baseUrl}/journal-entries`)      // WIP calculations
  ])


  return {
    profitAndLoss: await plData.json(),
    balanceSheet: await bsData.json(),
    customers: await customers.json(),
    suppliers: await suppliers.json(),
    billings: await invoices.json(),
    payables: await bills.json(),
    wipData: analyzeWIPFromJournalEntries(await journalEntries.json())
  }
}
Why you need all these endpoints:
- P&L → Profitability and margin analysis
- Balance Sheet → WIP position, retainage, liquidity
- Customers → AR aging and billing patterns
- Suppliers → Subcontractor payment health
- Invoices → Progress billing analysis
- Bills → Payment cycle tracking
- Journal Entries → WIP account reconciliation
📊 Critical Construction Lending Metrics
1. Work in Progress (WIP) Analysis
The single most important construction-specific metric. WIP reveals whether a contractor is ahead or behind on their projects—and whether they're managing costs effectively.
Understanding WIP Components
function analyzeWIP(balanceSheetData) {
  // Extract WIP-related accounts from Balance Sheet
  const unbilledReceivables = findAccount(
    balanceSheetData.assets.current_assets.records,
    'Unbilled Receivables'
  )


  const costsInExcess = findAccount(
    balanceSheetData.assets.current_assets.records,
    'Costs in Excess of Billings'
  )


  const billingsInExcess = findAccount(
    balanceSheetData.liabilities.current_liabilities.records,
    'Billings in Excess of Costs'
  )


  // Calculate WIP position
  const wipAsset = unbilledReceivables + costsInExcess    // Underbilled
  const wipLiability = billingsInExcess                   // Overbilled
  const netWIPPosition = wipAsset - wipLiability


  return {
    underbilled: wipAsset,
    overbilled: wipLiability,
    netPosition: netWIPPosition,
    wipRatio: wipAsset / (wipAsset + wipLiability),
    healthScore: calculateWIPHealthScore(wipAsset, wipLiability)
  }
}


// Helper to find specific account in Balance Sheet
function findAccount(accounts, searchTerm) {
  const account = accounts.find(acc =>
    acc.title.toLowerCase().includes(searchTerm.toLowerCase())
  )
  return account?.total || 0
}


function calculateWIPHealthScore(wipAsset, wipLiability) {
  // Underbilled = Good (company ahead on work, cash coming)
  // Overbilled = Warning (billing ahead of work, potential delays)


  if (wipLiability > wipAsset * 1.5) {
    return {
      score: 'Poor',
      concern: 'Significant overbilling suggests project delays or cost overruns',
      risk: 'HIGH'
    }
  }


  if (wipAsset > wipLiability && wipAsset > 0) {
    return {
      score: 'Excellent',
      note: 'Underbilled position indicates work ahead of billing',
      risk: 'LOW'
    }
  }


  if (Math.abs(wipAsset - wipLiability) / Math.max(wipAsset, wipLiability) < 0.2) {
    return {
      score: 'Good',
      note: 'WIP position relatively balanced',
      risk: 'MEDIUM'
    }
  }


  return {
    score: 'Fair',
    note: 'Moderate overbilling requires monitoring',
    risk: 'MEDIUM-HIGH'
  }
}
What WIP Tells You
| WIP Position | Meaning | Lending Implication |
|---|---|---|
| Underbilled (Costs > Billings) | Company completed work but hasn't billed yet | ✅ Positive - Cash incoming, work progressing |
| Balanced (Costs ≈ Billings) | Billing pace matches work completion | ✅ Neutral - Normal operations |
| Overbilled (Billings > Costs) | Billing ahead of actual work done | ⚠️ Warning - Project delays or cost overruns |
| Severely Overbilled (Billings >> Costs) | Major gap between billing and completion | 🚨 Critical - High default risk |
Real-world example:
// Contractor A: Healthy WIP
{
  underbilled: 250000,      // $250K work done, not yet billed
  overbilled: 50000,        // $50K billed ahead on one project
  netPosition: 200000,      // Net underbilled by $200K
  healthScore: 'Excellent'  // Strong position
}


// Contractor B: Problem WIP
{
  underbilled: 75000,       // Only $75K ahead on work
  overbilled: 400000,       // $400K billed but not completed
  netPosition: -325000,     // Net overbilled by $325K
  healthScore: 'Poor'       // High risk of project losses
}
2. Adjusted Liquidity Ratios
Standard current ratio misleads with construction companies because retainage is technically a current asset but not liquid.
Construction-Adjusted Current Ratio
function calculateAdjustedLiquidity(balanceSheet) {
  const currentAssets = balanceSheet.assets.current_assets.total
  const currentLiabilities = balanceSheet.liabilities.current_liabilities.total


  // Find retainage (locked cash not available for operations)
  const retainageReceivable = findAccount(
    balanceSheet.assets.current_assets.records,
    'Retainage Receivable'
  )


  // Find costs in excess (may not convert to cash if project problems exist)
  const costsInExcess = findAccount(
    balanceSheet.assets.current_assets.records,
    'Costs in Excess'
  )


  // Standard ratio (misleading for construction)
  const standardCurrentRatio = currentAssets / currentLiabilities


  // Adjusted ratio (more realistic)
  const adjustedCurrentAssets = currentAssets - retainageReceivable - (costsInExcess * 0.5)
  const adjustedCurrentRatio = adjustedCurrentAssets / currentLiabilities


  // Cash + AR ratio (most conservative)
  const cash = findAccount(balanceSheet.assets.current_assets.records, 'Cash')
  const ar = findAccount(balanceSheet.assets.current_assets.records, 'Accounts Receivable')
  const cashARRatio = (cash + ar) / currentLiabilities


  return {
    standardRatio: standardCurrentRatio.toFixed(2),
    adjustedRatio: adjustedCurrentRatio.toFixed(2),
    cashARRatio: cashARRatio.toFixed(2),
    assessment: assessConstructionLiquidity(adjustedCurrentRatio, cashARRatio),
    retainagePercentage: ((retainageReceivable / currentAssets) * 100).toFixed(1)
  }
}


function assessConstructionLiquidity(adjustedRatio, cashARRatio) {
  if (adjustedRatio > 1.5 && cashARRatio > 1.2) {
    return {
      rating: 'Strong',
      note: 'Excellent liquidity even after adjustments',
      risk: 'LOW'
    }
  }


  if (adjustedRatio > 1.2 && cashARRatio > 0.8) {
    return {
      rating: 'Adequate',
      note: 'Acceptable liquidity for construction operations',
      risk: 'MEDIUM'
    }
  }


  if (adjustedRatio < 1.0 || cashARRatio < 0.6) {
    return {
      rating: 'Weak',
      note: 'Liquidity concerns - may struggle with cash flow gaps',
      risk: 'HIGH'
    }
  }


  return {
    rating: 'Fair',
    note: 'Tight liquidity requires monitoring',
    risk: 'MEDIUM-HIGH'
  }
}
Example Output:
{
  standardRatio: "2.1",           // Looks great!
  adjustedRatio: "1.3",           // More realistic
  cashARRatio: "0.9",             // Actual liquid position
  assessment: {
    rating: "Fair",
    note: "Tight liquidity requires monitoring",
    risk: "MEDIUM-HIGH"
  },
  retainagePercentage: "18.5"     // Almost 20% of assets locked up
}
3. Backlog Analysis (Revenue Visibility)
Backlog = Total contracted work not yet completed. This gives lenders revenue visibility that P&L statements can't provide.
// Note: Backlog often comes from project management systems
// This example shows how to analyze it with P&L data
function analyzeBacklog(profitAndLoss, contractBacklog) {
  const annualRevenue = profitAndLoss.revenue.total
  const monthlyRevenue = annualRevenue / 12


  // Calculate how many months of work are contracted
  const backlogMonths = contractBacklog / monthlyRevenue


  // Calculate burn rate (how fast they complete work)
  const burnRate = annualRevenue / contractBacklog


  return {
    totalBacklog: contractBacklog,
    backlogMonths: backlogMonths.toFixed(1),
    monthlyBurnRate: monthlyRevenue.toFixed(0),
    assessment: assessBacklogHealth(backlogMonths),
    revenueVisibility: `${backlogMonths.toFixed(0)} months of contracted revenue`
  }
}


function assessBacklogHealth(backlogMonths) {
  if (backlogMonths < 3) {
    return {
      rating: 'Critical',
      concern: 'Insufficient backlog - revenue risk within 90 days',
      action: 'Require evidence of pipeline or reduce loan amount',
      risk: 'HIGH'
    }
  }


  if (backlogMonths < 6) {
    return {
      rating: 'Weak',
      concern: 'Limited backlog - need new contracts soon',
      action: 'Monitor bidding activity and win rates',
      risk: 'MEDIUM-HIGH'
    }
  }


  if (backlogMonths >= 6 && backlogMonths <= 18) {
    return {
      rating: 'Healthy',
      note: 'Solid revenue visibility',
      action: 'Standard monitoring',
      risk: 'LOW'
    }
  }


  if (backlogMonths > 18) {
    return {
      rating: 'Excessive',
      concern: 'Very long backlog may indicate capacity constraints',
      action: 'Verify company can execute this volume',
      risk: 'MEDIUM'
    }
  }
}
Why backlog matters for lending:
- <3 months → Revenue cliff approaching, high default risk
- 3-6 months → Acceptable but needs new contracts soon
- 6-18 months → Ideal range, good revenue visibility
- >18 months → May lack capacity to execute all work
4. Gross Profit Margin by Account Category
Construction margins reveal pricing power and project execution quality.
function analyzeConstructionMargins(profitAndLoss) {
  const revenue = profitAndLoss.revenue.total
  const costOfGoodsSold = profitAndLoss.expenses.records.find(
    exp => exp.id === '111' || exp.title.toLowerCase().includes('cost of goods')
  )?.total || 0


  const grossProfit = profitAndLoss.gross_profit
  const grossMargin = (grossProfit / revenue) * 100


  // Identify margin trends from individual expense categories
  const directLaborCosts = findExpenseCategory(profitAndLoss, 'Employee costs')
  const materialCosts = findExpenseCategory(profitAndLoss, 'Materials')
  const subcontractorCosts = findExpenseCategory(profitAndLoss, 'Subcontractors')


  const laborMargin = ((revenue - directLaborCosts) / revenue) * 100
  const materialMargin = ((revenue - materialCosts) / revenue) * 100


  return {
    grossMargin: grossMargin.toFixed(1),
    assessment: benchmarkConstructionMargin(grossMargin),
    laborMargin: laborMargin.toFixed(1),
    materialMargin: materialMargin.toFixed(1),
    marginComposition: {
      directCosts: ((costOfGoodsSold / revenue) * 100).toFixed(1),
      operatingExpenses: (((profitAndLoss.expenses.total - costOfGoodsSold) / revenue) * 100).toFixed(1)
    }
  }
}


function benchmarkConstructionMargin(grossMargin) {
  // Industry benchmarks vary by construction type
  const benchmarks = {
    commercial_gc: { min: 8, target: 15, excellent: 20 },
    residential: { min: 10, target: 18, excellent: 25 },
    specialty: { min: 15, target: 25, excellent: 35 },
    heavy_civil: { min: 5, target: 10, excellent: 15 }
  }


  // Using general contractor benchmarks as default
  const bench = benchmarks.commercial_gc


  if (grossMargin >= bench.excellent) {
    return {
      rating: 'Excellent',
      note: `${grossMargin.toFixed(1)}% gross margin - strong pricing and execution`,
      risk: 'LOW'
    }
  }


  if (grossMargin >= bench.target) {
    return {
      rating: 'Good',
      note: `${grossMargin.toFixed(1)}% gross margin - acceptable for construction`,
      risk: 'LOW-MEDIUM'
    }
  }


  if (grossMargin >= bench.min) {
    return {
      rating: 'Fair',
      note: `${grossMargin.toFixed(1)}% gross margin - thin but viable`,
      risk: 'MEDIUM'
    }
  }


  return {
    rating: 'Poor',
    concern: `${grossMargin.toFixed(1)}% gross margin - below sustainable levels`,
    risk: 'HIGH'
  }
}


function findExpenseCategory(profitAndLoss, categoryName) {
  const category = profitAndLoss.expenses.records.find(
    exp => exp.title.toLowerCase().includes(categoryName.toLowerCase())
  )
  return category?.total || 0
}
Construction Margin Benchmarks:
| Construction Type | Minimum | Target | Excellent |
|---|---|---|---|
| Commercial GC | 8% | 15% | 20%+ |
| Residential Builder | 10% | 18% | 25%+ |
| Specialty Contractor | 15% | 25% | 35%+ |
| Heavy Civil | 5% | 10% | 15%+ |
5. Construction-Specific Red Flags
function identifyConstructionRedFlags(plData, bsData, historicalData) {
  const redFlags = []


  // 1. Overbilling Trend (pulling revenue ahead of work)
  const wipAnalysis = analyzeWIP(bsData)
  if (wipAnalysis.overbilled > wipAnalysis.underbilled * 1.5) {
    redFlags.push({
      severity: 'HIGH',
      flag: 'Significant Overbilling',
      detail: `$${wipAnalysis.overbilled.toLocaleString()} overbilled vs $${wipAnalysis.underbilled.toLocaleString()} underbilled`,
      implication: 'Potential project delays, cost overruns, or aggressive revenue recognition',
      action: 'Request project-level detail and completion schedules'
    })
  }


  // 2. Retainage Accumulation (too much cash tied up)
  const retainage = findAccount(bsData.assets.current_assets.records, 'Retainage')
  const retainageRatio = (retainage / plData.revenue.total) * 100
  if (retainageRatio > 15) {
    redFlags.push({
      severity: 'MEDIUM',
      flag: 'Excessive Retainage',
      detail: `$${retainage.toLocaleString()} (${retainageRatio.toFixed(1)}% of annual revenue)`,
      implication: 'Significant working capital tied up, potential project closeout delays',
      action: 'Review aging of retainage and project completion timelines'
    })
  }


  // 3. Growing AP While Revenue Flat/Declining
  const currentAP = findAccount(bsData.liabilities.current_liabilities.records, 'Accounts Payable')
  const priorAP = historicalData?.priorBalanceSheet
    ? findAccount(historicalData.priorBalanceSheet.liabilities.current_liabilities.records, 'Accounts Payable')
    : currentAP


  const apGrowth = ((currentAP - priorAP) / priorAP) * 100
  const revenueGrowth = historicalData?.priorPL
    ? ((plData.revenue.total - historicalData.priorPL.revenue.total) / historicalData.priorPL.revenue.total) * 100
    : 0


  if (apGrowth > 20 && revenueGrowth < 5) {
    redFlags.push({
      severity: 'HIGH',
      flag: 'AP Growing Faster Than Revenue',
      detail: `AP up ${apGrowth.toFixed(1)}% while revenue up only ${revenueGrowth.toFixed(1)}%`,
      implication: 'Subcontractor payment delays, potential cash flow crisis',
      action: 'Request AR aging and verify timely subcontractor payments'
    })
  }


  // 4. Gross Margin Compression
  const currentMargin = (plData.gross_profit / plData.revenue.total) * 100
  const priorMargin = historicalData?.priorPL
    ? (historicalData.priorPL.gross_profit / historicalData.priorPL.revenue.total) * 100
    : currentMargin


  const marginDecline = currentMargin - priorMargin
  if (marginDecline < -5) {
    redFlags.push({
      severity: 'HIGH',
      flag: 'Deteriorating Gross Margins',
      detail: `Margin declined ${Math.abs(marginDecline).toFixed(1)} percentage points`,
      implication: 'Pricing pressure, cost overruns, or losing money on current projects',
      action: 'Review job costing by project and identify problem contracts'
    })
  }


  // 5. Low Backlog (if available)
  // This would typically come from external data or integration-level settings
  const backlogMonths = historicalData?.backlogMonths || null
  if (backlogMonths !== null && backlogMonths < 3) {
    redFlags.push({
      severity: 'CRITICAL',
      flag: 'Insufficient Backlog',
      detail: `Only ${backlogMonths.toFixed(1)} months of contracted work remaining`,
      implication: 'Revenue cliff approaching, high default probability',
      action: 'Require evidence of bidding pipeline or deny/reduce loan'
    })
  }


  // 6. Negative Working Capital
  const workingCapital = bsData.assets.current_assets.total - bsData.liabilities.current_liabilities.total
  if (workingCapital < 0) {
    redFlags.push({
      severity: 'CRITICAL',
      flag: 'Negative Working Capital',
      detail: `Working capital: $${workingCapital.toLocaleString()}`,
      implication: 'Company cannot meet short-term obligations',
      action: 'Deny loan or require equity injection'
    })
  }


  return {
    totalFlags: redFlags.length,
    criticalFlags: redFlags.filter(f => f.severity === 'CRITICAL').length,
    highFlags: redFlags.filter(f => f.severity === 'HIGH').length,
    flags: redFlags,
    overallRisk: assessOverallConstructionRisk(redFlags)
  }
}


function assessOverallConstructionRisk(redFlags) {
  const criticalCount = redFlags.filter(f => f.severity === 'CRITICAL').length
  const highCount = redFlags.filter(f => f.severity === 'HIGH').length


  if (criticalCount > 0) {
    return {
      level: 'CRITICAL',
      recommendation: 'DECLINE LOAN',
      rationale: `${criticalCount} critical red flag(s) identified`
    }
  }


  if (highCount >= 2) {
    return {
      level: 'HIGH',
      recommendation: 'DECLINE OR REQUIRE SIGNIFICANT MITIGANTS',
      rationale: `${highCount} high-severity red flags identified`
    }
  }


  if (highCount === 1) {
    return {
      level: 'ELEVATED',
      recommendation: 'CONDITIONAL APPROVAL WITH ENHANCED MONITORING',
      rationale: '1 high-severity red flag requires close oversight'
    }
  }


  return {
    level: 'STANDARD',
    recommendation: 'PROCEED WITH STANDARD UNDERWRITING',
    rationale: 'No critical red flags identified'
  }
}
🏗️ Construction Lending Use Cases
1. Equipment Financing
Construction equipment is expensive and depreciates rapidly. Lenders need to assess cash flow capacity and equipment utilization.
async function assessEquipmentFinancing(customerId, proposedEquipment) {
  // Fetch financial data
  const { profitAndLoss, balanceSheet } = await fetchConstructionFinancials(
    customerId,
    { start: '2025-01-01', end: '2025-12-31' }
  )


  // Calculate EBITDA for debt service capacity
  const ebitda = calculateEBITDA(profitAndLoss)


  // Extract existing equipment value
  const existingEquipment = findAccount(
    balanceSheet.assets.non_current_assets.records,
    'Machinery & Equipment'
  )


  const accumulatedDepreciation = findAccount(
    balanceSheet.assets.non_current_assets.records,
    'Accumulated Depreciation'
  )


  const netEquipmentValue = existingEquipment - Math.abs(accumulatedDepreciation)


  // Calculate debt service coverage
  const existingDebtService = 120000  // Would come from loan schedule
  const proposedDebtService = calculateDebtService(
    proposedEquipment.amount,
    proposedEquipment.rate,
    proposedEquipment.term
  )


  const totalDebtService = existingDebtService + proposedDebtService
  const dscr = ebitda / totalDebtService


  return {
    ebitda: ebitda,
    existingEquipmentValue: netEquipmentValue,
    proposedLoan: proposedEquipment.amount,
    proposedPayment: proposedDebtService,
    totalAnnualDebtService: totalDebtService,
    dscr: dscr.toFixed(2),
    assessment: assessEquipmentLoan(dscr, netEquipmentValue, proposedEquipment.amount),
    recommendation: dscr >= 1.5 ? 'APPROVE' : dscr >= 1.25 ? 'CONDITIONAL' : 'DECLINE'
  }
}


function calculateEBITDA(profitAndLoss) {
  const netIncome = profitAndLoss.net_income


  // Add back depreciation
  const depreciation = findExpenseCategory(profitAndLoss, 'Depreciation') || 0


  // Add back interest (if separated)
  const interest = findExpenseCategory(profitAndLoss, 'Interest') || 0


  // Add back taxes
  const taxes = findExpenseCategory(profitAndLoss, 'Income taxes') || 0


  return netIncome + depreciation + interest + taxes
}


function calculateDebtService(amount, rate, termYears) {
  const monthlyRate = rate / 12 / 100
  const numPayments = termYears * 12


  const monthlyPayment = amount * (monthlyRate * Math.pow(1 + monthlyRate, numPayments))
    / (Math.pow(1 + monthlyRate, numPayments) - 1)


  return monthlyPayment * 12  // Annual debt service
}


function assessEquipmentLoan(dscr, existingEquipment, loanAmount) {
  if (dscr >= 1.5) {
    return {
      rating: 'Strong',
      note: `DSCR of ${dscr.toFixed(2)} provides strong debt service coverage`,
      risk: 'LOW'
    }
  }


  if (dscr >= 1.25) {
    return {
      rating: 'Acceptable',
      note: `DSCR of ${dscr.toFixed(2)} is adequate but requires monitoring`,
      risk: 'MEDIUM'
    }
  }


  return {
    rating: 'Insufficient',
    concern: `DSCR of ${dscr.toFixed(2)} below minimum threshold`,
    risk: 'HIGH'
  }
}
Equipment Financing Decision Matrix:
| DSCR | Existing Equipment | Decision |
|---|---|---|
| >1.5 | Any | ✅ Approve |
| 1.25-1.5 | >3x loan amount | ✅ Approve |
| 1.25-1.5 | <3x loan amount | ⚠️ Conditional |
| <1.25 | >5x loan amount | ⚠️ Conditional (equipment secures loan) |
| <1.25 | <5x loan amount | ❌ Decline |
2. Working Capital Line of Credit
Construction companies need revolving credit to manage cash flow gaps between billing and payment cycles.
function assessWorkingCapitalLine(balanceSheet, requestedLine) {
  // Calculate borrowing base (% of eligible receivables)
  const totalAR = findAccount(balanceSheet.assets.current_assets.records, 'Accounts Receivable')
  const contractReceivables = findAccount(balanceSheet.assets.current_assets.records, 'Contract Receivables')
  const retainage = findAccount(balanceSheet.assets.current_assets.records, 'Retainage')


  // Typically 80% advance rate on AR <90 days, 0% on retainage
  const eligibleAR = (totalAR + contractReceivables - retainage) * 0.80


  // Sometimes include costs in excess at reduced rate
  const costsInExcess = findAccount(balanceSheet.assets.current_assets.records, 'Costs in Excess')
  const eligibleCosts = costsInExcess * 0.50  // Conservative 50% advance


  const borrowingBase = eligibleAR + eligibleCosts


  // Find existing line utilization
  const existingLine = findAccount(balanceSheet.liabilities.current_liabilities.records, 'Line of Credit') || 0


  const availableCapacity = borrowingBase - existingLine
  const proposedUtilization = ((existingLine + requestedLine) / borrowingBase) * 100


  return {
    totalAR: totalAR,
    eligibleAR: eligibleAR,
    costsInExcess: costsInExcess,
    eligibleCosts: eligibleCosts,
    borrowingBase: borrowingBase,
    currentBorrowing: existingLine,
    requestedLine: requestedLine,
    proposedUtilization: proposedUtilization.toFixed(1),
    availableCapacity: availableCapacity,
    assessment: assessLineCapacity(proposedUtilization, availableCapacity, requestedLine),
    recommendation: proposedUtilization < 75 && availableCapacity >= requestedLine
      ? 'APPROVE'
      : proposedUtilization < 85
        ? 'CONDITIONAL'
        : 'DECLINE'
  }
}


function assessLineCapacity(utilization, available, requested) {
  if (utilization > 90) {
    return {
      rating: 'Exceeded',
      concern: `${utilization}% utilization - borrowing base insufficient`,
      risk: 'HIGH'
    }
  }


  if (utilization > 75) {
    return {
      rating: 'High Utilization',
      note: `${utilization}% utilization indicates tight cash flow`,
      risk: 'MEDIUM-HIGH'
    }
  }


  if (available < requested * 1.2) {
    return {
      rating: 'Limited Capacity',
      note: 'Borrowing base provides minimal cushion for requested line',
      risk: 'MEDIUM'
    }
  }


  return {
    rating: 'Adequate',
    note: `${utilization}% utilization with sufficient capacity`,
    risk: 'LOW'
  }
}
3. Bonding Capacity Assessment
Surety bonds are required for public works and many private projects. Bonding capacity limits how much work a contractor can bid.
function assessBondingCapacity(balanceSheet, contractBacklog) {
  // Calculate Tangible Net Worth (exclude intangibles)
  const totalEquity = balanceSheet.equity.total
  const intangibleAssets = findAccount(balanceSheet.assets.non_current_assets.records, 'Intangible Assets') || 0
  const tangibleNetWorth = totalEquity - intangibleAssets


  // Calculate Working Capital
  const workingCapital = balanceSheet.assets.current_assets.total - balanceSheet.liabilities.current_liabilities.total


  // Surety underwriting rules (industry standard)
  const singleProjectLimit = tangibleNetWorth * 6  // Conservative 6x (can be 5-10x)
  const aggregateBacklogLimit = tangibleNetWorth * 12  // Conservative 12x (can be 10-20x)


  // Calculate current utilization
  const largestProject = contractBacklog.largestProjectValue || 0
  const totalBacklog = contractBacklog.total || 0


  const singleProjectUtilization = (largestProject / singleProjectLimit) * 100
  const aggregateUtilization = (totalBacklog / aggregateBacklogLimit) * 100


  return {
    tangibleNetWorth: tangibleNetWorth,
    workingCapital: workingCapital,
    bondingCapacity: {
      singleProject: singleProjectLimit,
      aggregate: aggregateBacklogLimit
    },
    currentBacklog: {
      largest: largestProject,
      total: totalBacklog
    },
    utilization: {
      singleProject: singleProjectUtilization.toFixed(1),
      aggregate: aggregateUtilization.toFixed(1)
    },
    availableCapacity: {
      singleProject: singleProjectLimit - largestProject,
      aggregate: aggregateBacklogLimit - totalBacklog
    },
    assessment: assessBondingHealth(singleProjectUtilization, aggregateUtilization, workingCapital)
  }
}


function assessBondingHealth(singleUtil, aggregateUtil, workingCapital) {
  if (workingCapital < 0) {
    return {
      rating: 'Unbondable',
      concern: 'Negative working capital - surety will not provide bonds',
      risk: 'CRITICAL'
    }
  }


  if (aggregateUtil > 90 || singleUtil > 90) {
    return {
      rating: 'Maxed Out',
      concern: 'Bonding capacity fully utilized - cannot bid additional work',
      risk: 'HIGH'
    }
  }


  if (aggregateUtil > 75 || singleUtil > 75) {
    return {
      rating: 'Limited Capacity',
      note: 'Bonding capacity constraints may limit growth',
      risk: 'MEDIUM'
    }
  }


  return {
    rating: 'Healthy',
    note: 'Adequate bonding capacity available',
    risk: 'LOW'
  }
}
🌡️ Seasonal Adjustments for Construction
Construction revenue varies dramatically by season. Annualizing Q1 winter revenue as if it's representative of the full year leads to massive underwriting errors.
function adjustForSeasonality(profitAndLoss, reportEndDate) {
  const reportDate = new Date(reportEndDate)
  const month = reportDate.getMonth()  // 0 = January, 11 = December
  const quarter = Math.floor(month / 3)


  // Regional seasonal patterns (example: Northern US)
  const seasonalFactors = {
    Q1: 0.65,  // Jan-Mar: 65% of average (winter slow season)
    Q2: 0.95,  // Apr-Jun: 95% of average (spring ramp-up)
    Q3: 1.20,  // Jul-Sep: 120% of average (peak summer season)
    Q4: 1.00   // Oct-Dec: 100% of average (fall strong season)
  }


  const quarterFactor = seasonalFactors[`Q${quarter + 1}`]
  const reportedQuarterlyRevenue = profitAndLoss.revenue.total


  // Annualize based on seasonal pattern
  const annualizedRevenue = (reportedQuarterlyRevenue / quarterFactor) * 4


  // Also adjust expenses (but operating expenses less seasonal than revenue)
  const reportedCOGS = profitAndLoss.expenses.records.find(e => e.id === '111')?.total || 0
  const annualizedCOGS = (reportedCOGS / quarterFactor) * 4


  const reportedOpex = profitAndLoss.expenses.total - reportedCOGS
  const annualizedOpex = reportedOpex * 4  // Operating expenses more stable


  return {
    reported: {
      quarter: `Q${quarter + 1}`,
      revenue: reportedQuarterlyRevenue,
      grossProfit: profitAndLoss.gross_profit,
      grossMargin: ((profitAndLoss.gross_profit / reportedQuarterlyRevenue) * 100).toFixed(1)
    },
    annualized: {
      revenue: annualizedRevenue,
      cogs: annualizedCOGS,
      opex: annualizedOpex,
      grossProfit: annualizedRevenue - annualizedCOGS,
      grossMargin: (((annualizedRevenue - annualizedCOGS) / annualizedRevenue) * 100).toFixed(1),
      netIncome: annualizedRevenue - annualizedCOGS - annualizedOpex
    },
    seasonalAdjustment: {
      factor: quarterFactor,
      note: quarter === 0
        ? 'Winter quarter - revenue artificially low'
        : quarter === 2
          ? 'Peak summer quarter - revenue artificially high'
          : 'Moderate seasonal impact'
    },
    warningNote: 'Use annualized figures for credit decisioning, not reported quarterly data'
  }
}
Why this matters:
- A contractor with $500K Q1 revenue might actually do $3M annually
- Without seasonal adjustment, you'd underestimate revenue by 6x
- Conversely, $1M Q3 revenue might only annualize to $3.3M, not $4M
🎯 Construction Credit Scoring Model
Putting it all together into an automated construction credit score:
async function scoreConstructionCompany(customerId, historicalData) {
  // Fetch current financials
  const { profitAndLoss, balanceSheet } = await fetchConstructionFinancials(
    customerId,
    { start: '2025-01-01', end: '2025-12-31' }
  )


  let score = 100
  const scorecard = []


  // 1. Profitability (25 points)
  const grossMargin = (profitAndLoss.gross_profit / profitAndLoss.revenue.total) * 100
  if (grossMargin > 20) {
    scorecard.push({ category: 'Gross Margin', points: 25, note: `${grossMargin.toFixed(1)}% - Excellent` })
  } else if (grossMargin > 15) {
    scorecard.push({ category: 'Gross Margin', points: 20, note: `${grossMargin.toFixed(1)}% - Good` })
    score -= 5
  } else if (grossMargin > 10) {
    scorecard.push({ category: 'Gross Margin', points: 12, note: `${grossMargin.toFixed(1)}% - Fair` })
    score -= 13
  } else {
    scorecard.push({ category: 'Gross Margin', points: 3, note: `${grossMargin.toFixed(1)}% - Weak` })
    score -= 22
  }


  // 2. Liquidity (20 points)
  const liquidityAnalysis = calculateAdjustedLiquidity(balanceSheet)
  const adjustedRatio = parseFloat(liquidityAnalysis.adjustedRatio)
  if (adjustedRatio > 1.5) {
    scorecard.push({ category: 'Liquidity', points: 20, note: `Ratio: ${adjustedRatio} - Strong` })
  } else if (adjustedRatio > 1.2) {
    scorecard.push({ category: 'Liquidity', points: 14, note: `Ratio: ${adjustedRatio} - Adequate` })
    score -= 6
  } else if (adjustedRatio > 1.0) {
    scorecard.push({ category: 'Liquidity', points: 8, note: `Ratio: ${adjustedRatio} - Tight` })
    score -= 12
  } else {
    scorecard.push({ category: 'Liquidity', points: 2, note: `Ratio: ${adjustedRatio} - Critical` })
    score -= 18
  }


  // 3. WIP Position (20 points)
  const wipAnalysis = analyzeWIP(balanceSheet)
  const wipHealthScore = wipAnalysis.healthScore.score
  if (wipHealthScore === 'Excellent') {
    scorecard.push({ category: 'WIP Position', points: 20, note: 'Healthy underbilled position' })
  } else if (wipHealthScore === 'Good') {
    scorecard.push({ category: 'WIP Position', points: 14, note: 'Balanced WIP' })
    score -= 6
  } else if (wipHealthScore === 'Fair') {
    scorecard.push({ category: 'WIP Position', points: 8, note: 'Moderate overbilling' })
    score -= 12
  } else {
    scorecard.push({ category: 'WIP Position', points: 2, note: 'Significant overbilling risk' })
    score -= 18
  }


  // 4. Backlog (15 points)
  const backlogMonths = historicalData?.backlogMonths || 0
  if (backlogMonths >= 6 && backlogMonths <= 18) {
    scorecard.push({ category: 'Backlog', points: 15, note: `${backlogMonths} months - Healthy` })
  } else if (backlogMonths >= 3 && backlogMonths < 6) {
    scorecard.push({ category: 'Backlog', points: 8, note: `${backlogMonths} months - Limited` })
    score -= 7
  } else if (backlogMonths < 3) {
    scorecard.push({ category: 'Backlog', points: 0, note: `${backlogMonths} months - Insufficient` })
    score -= 15
  } else {
    scorecard.push({ category: 'Backlog', points: 10, note: `${backlogMonths} months - Excessive` })
    score -= 5
  }


  // 5. Leverage (10 points)
  const debtToEquity = balanceSheet.liabilities.total / balanceSheet.equity.total
  if (debtToEquity < 1.5) {
    scorecard.push({ category: 'Leverage', points: 10, note: `D/E: ${debtToEquity.toFixed(2)} - Conservative` })
  } else if (debtToEquity < 2.5) {
    scorecard.push({ category: 'Leverage', points: 6, note: `D/E: ${debtToEquity.toFixed(2)} - Moderate` })
    score -= 4
  } else {
    scorecard.push({ category: 'Leverage', points: 1, note: `D/E: ${debtToEquity.toFixed(2)} - High` })
    score -= 9
  }


  // 6. Growth & Trend (10 points)
  if (historicalData?.priorPL) {
    const revenueGrowth = ((profitAndLoss.revenue.total - historicalData.priorPL.revenue.total) / historicalData.priorPL.revenue.total) * 100
    const marginChange = ((profitAndLoss.gross_profit / profitAndLoss.revenue.total) * 100) - ((historicalData.priorPL.gross_profit / historicalData.priorPL.revenue.total) * 100)


    if (revenueGrowth > 15 && marginChange > -1) {
      scorecard.push({ category: 'Growth', points: 10, note: 'Strong growth with stable margins' })
    } else if (revenueGrowth > 5 || marginChange > -2) {
      scorecard.push({ category: 'Growth', points: 6, note: 'Moderate growth' })
      score -= 4
    } else {
      scorecard.push({ category: 'Growth', points: 1, note: 'Declining or margin compression' })
      score -= 9
    }
  } else {
    scorecard.push({ category: 'Growth', points: 5, note: 'No historical data' })
    score -= 5
  }


  return {
    totalScore: Math.max(0, score),
    rating: getConstructionRating(score),
    scorecard: scorecard,
    recommendation: getConstructionRecommendation(score),
    riskLevel: getRiskLevel(score)
  }
}


function getConstructionRating(score) {
  if (score >= 90) return 'Excellent (A+)'
  if (score >= 80) return 'Very Good (A)'
  if (score >= 70) return 'Good (B+)'
  if (score >= 60) return 'Acceptable (B)'
  if (score >= 50) return 'Marginal (C)'
  return 'Poor (D)'
}


function getConstructionRecommendation(score) {
  if (score >= 85) return 'APPROVE - Strong construction company, standard terms'
  if (score >= 75) return 'APPROVE - Solid company, standard monitoring'
  if (score >= 65) return 'APPROVE - Acceptable risk, enhanced monitoring required'
  if (score >= 55) return 'CONDITIONAL - Require additional collateral or guarantees'
  if (score >= 45) return 'MARGINAL - Significant conditions required, consider declining'
  return 'DECLINE - Risk exceeds acceptable thresholds'
}


function getRiskLevel(score) {
  if (score >= 80) return 'LOW'
  if (score >= 65) return 'MEDIUM'
  if (score >= 50) return 'HIGH'
  return 'VERY HIGH'
}
📊 Construction Lending Metrics Summary
| Metric | Calculation | Good | Acceptable | Warning |
|---|---|---|---|---|
| Gross Profit Margin | (Revenue - COGS) / Revenue | >20% | 10-20% | <10% |
| Adjusted Current Ratio | (CA - Retainage) / CL | >1.5 | 1.2-1.5 | <1.2 |
| Cash + AR / CL | (Cash + AR) / CL | >1.2 | 0.8-1.2 | <0.8 |
| WIP Position | Costs in Excess - Billings in Excess | Positive | Near zero | Negative |
| Retainage % | Retainage / Annual Revenue | <10% | 10-15% | >15% |
| Backlog Months | Remaining Backlog / Monthly Revenue | 6-18 mo | 3-6 mo | <3 mo |
| Debt to Equity | Total Liabilities / Equity | <1.5 | 1.5-2.5 | >2.5 |
| DSCR | EBITDA / Annual Debt Service | >1.5 | 1.25-1.5 | <1.25 |
| AR Turnover | Revenue / AR | >10x | 6-10x | <6x |
🚀 Implementation Roadmap
Phase 1: Core Construction Metrics (Week 1-2)
- Implement WIP analysis from Balance Sheet
- Calculate adjusted liquidity ratios
- Extract gross margin by expense category
- Build red flag detection system
Phase 2: Enhanced Analysis (Week 3-4)
- Add seasonal adjustment calculations
- Implement EBITDA and DSCR calculations
- Build bonding capacity assessment
- Create construction credit scoring model
Phase 3: Automation & Integration (Week 5-6)
- Integrate with accounting platforms via Apideck
- Build automated monitoring dashboards
- Set up alert systems for red flags
- Implement historical trend analysis
Phase 4: Advanced Features (Week 7-8)
- Add backlog tracking (if data available)
- Project-level profitability analysis
- Subcontractor payment monitoring
- Equipment utilization tracking
🎓 Best Practices for Construction Lending
1. Always Analyze WIP Position
WIP analysis is more important than net income for construction companies. A profitable P&L means nothing if the company is overbilled by $500K.
2. Adjust for Retainage
Never use standard current ratio. Always calculate adjusted current ratio excluding retainage from liquid assets.
3. Demand Backlog Visibility
Request backlog reports as part of the application. <3 months of backlog is a showstopper for most construction loans.
4. Monitor Margins Closely
Construction margins are thin. A 5-point margin decline often indicates serious project execution problems.
5. Understand Bonding Capacity
A contractor with maxed-out bonding can't bid new work, limiting revenue growth and creating refinancing risk.
6. Account for Seasonality
Never annualize Q1 winter results without seasonal adjustment. You'll dramatically underestimate revenue.
7. Track Subcontractor Payments
Growing AP while revenue is flat signals cash flow problems and potential mechanic's lien risks.
8. Require Project-Level Detail
For loans >$500K, request job costing reports showing profitability by project, not just company-wide.
🔗 Related Resources
- Using Accounting APIs for Smart Lending Decisions - Core B2B lending guide covering profitability, liquidity, and leverage ratios across all industries
- Apideck Accounting API Documentation - Complete API reference for financial statement endpoints
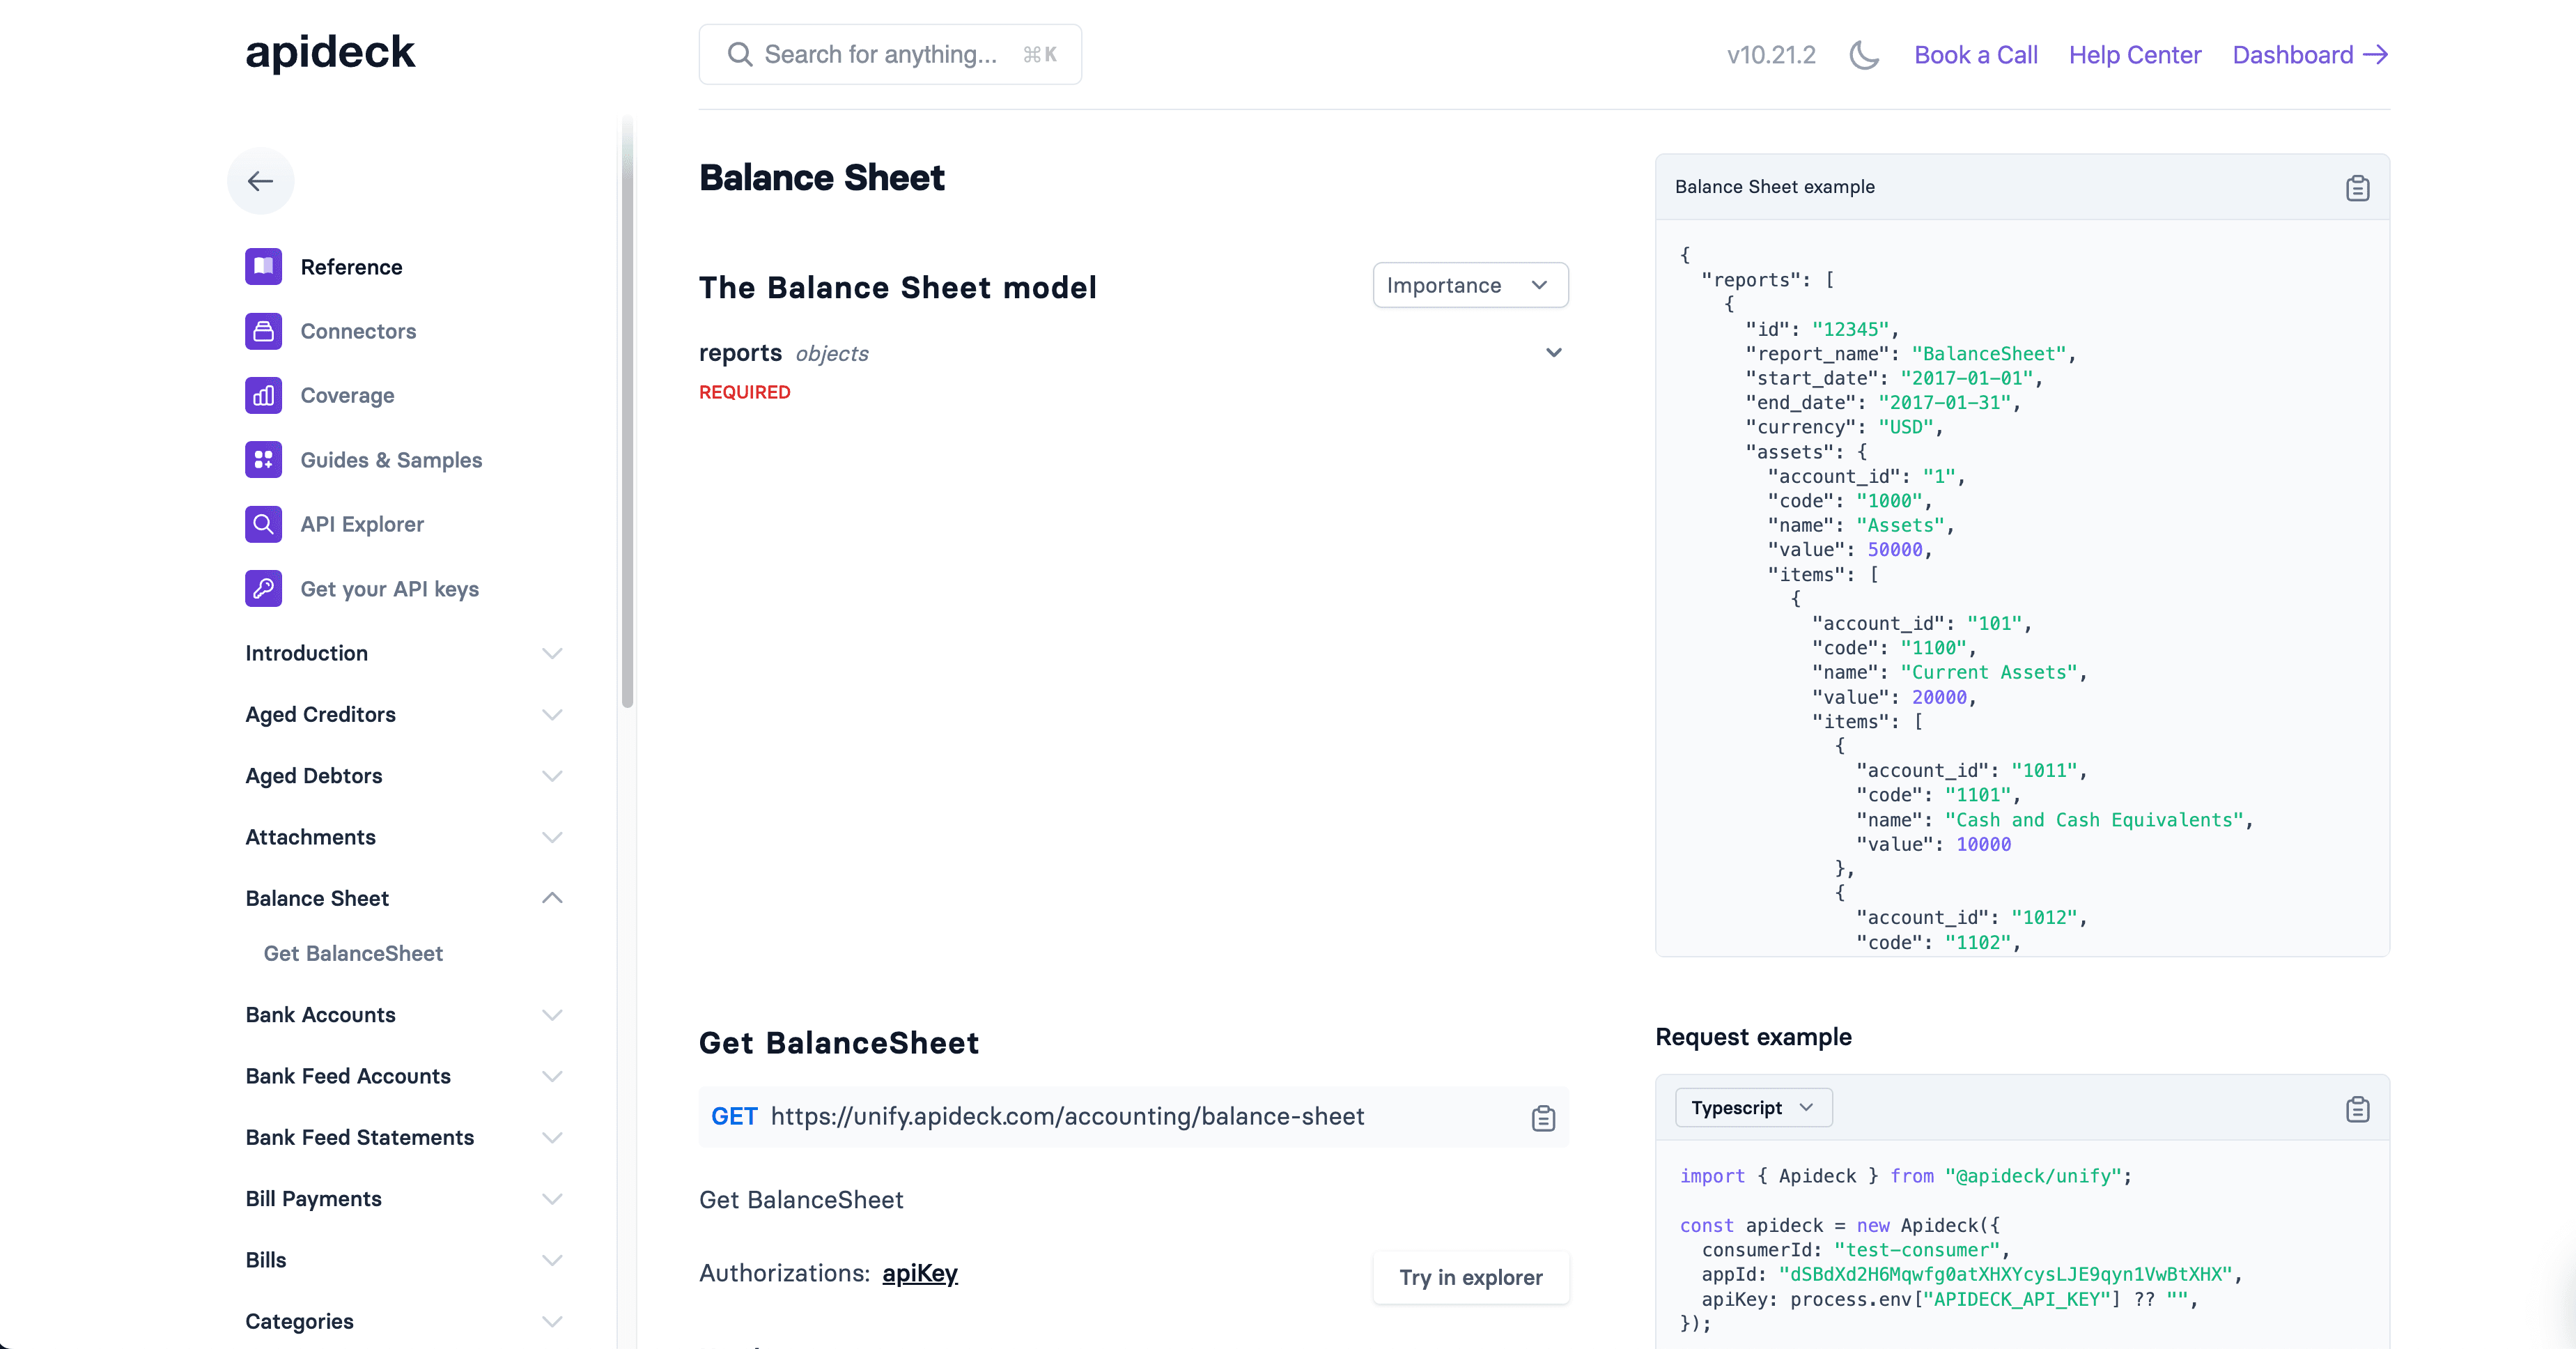
- Balance Sheet API Guide - Detailed Balance Sheet endpoint documentation
- Profit and Loss API Guide - P&L endpoint reference
Ready to get started?
Scale your integration strategy and deliver the integrations your customers need in record time.